Active backlog
See work still waiting in the triage queue instead of hiding it inside a total ticket count.
A headline SLA percentage can look healthy while old tickets wait, unclassified work grows, and plugin failures sit somewhere else. Latch Workflow puts workload health, data quality, AI readiness, and plugin health on one operations dashboard.
This is a ticket-queue dashboard, not infrastructure observability or generic business intelligence. It is built for the operations lead deciding what the team should fix next.
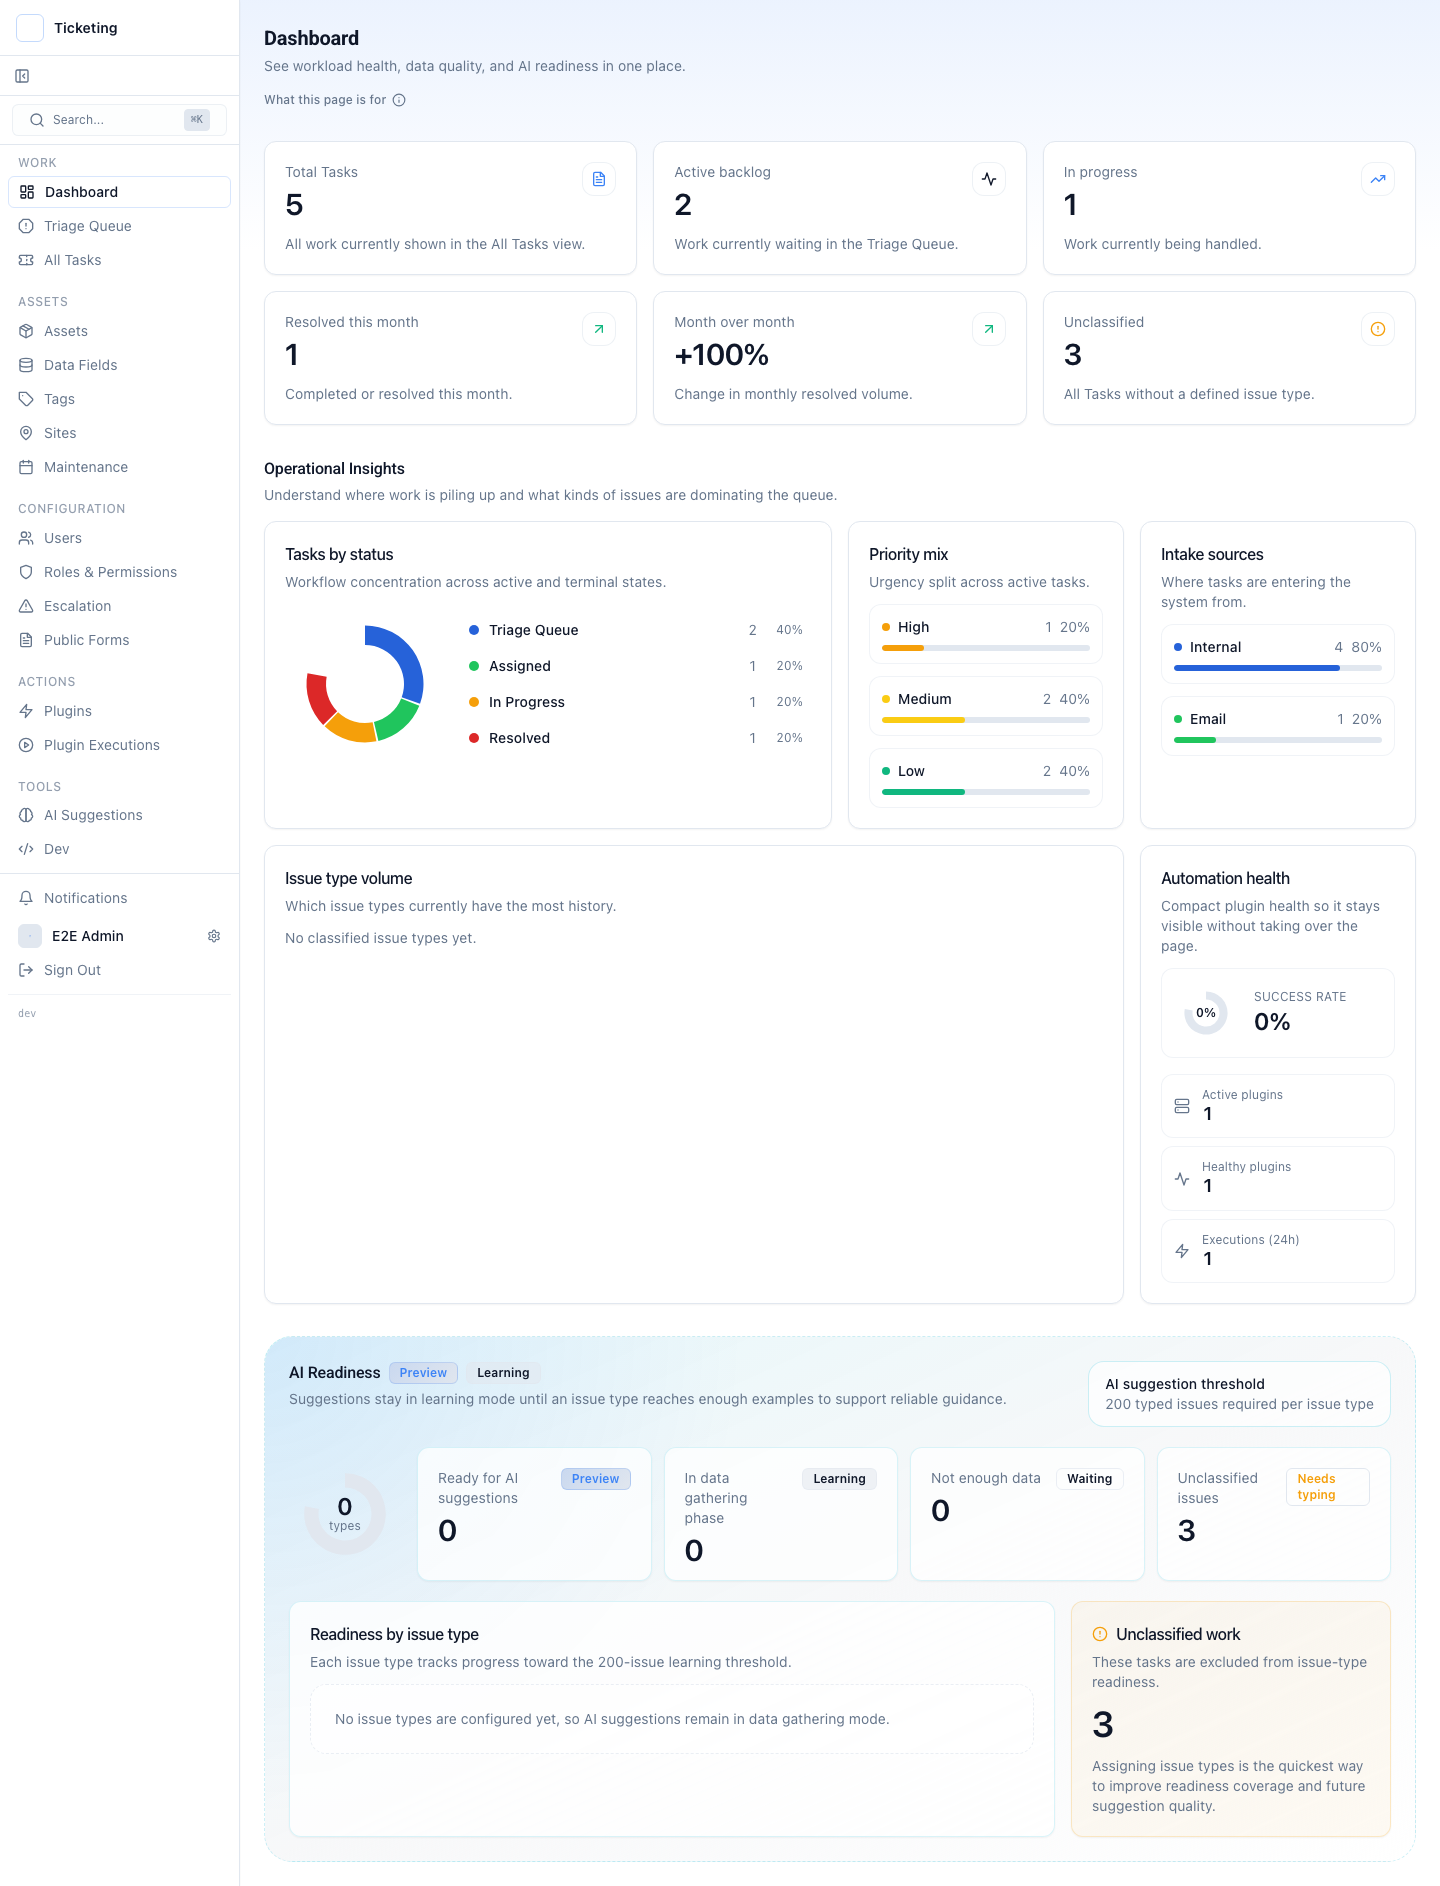
The dashboard keeps the top-level queue visible, then exposes the distribution and data-quality problems underneath it.
See work still waiting in the triage queue instead of hiding it inside a total ticket count.
See whether work is concentrated in triage, assigned, in progress, resolved, high, medium, or low priority.
See whether work enters from internal creation, email, forms, or other configured paths.
See which kinds of work dominate the queue once tickets are classified consistently.
Keep the tickets weakening reports, routing, and AI readiness visible until the data is fixed.
Compare completed or resolved volume over time without treating speed as the only definition of health.
Latch Workflow shows whether each issue type has enough typed examples to support suggestions. Unclassified work stays excluded from readiness instead of silently improving a headline score.
AI is native to the workflow, but the operator remains the decision-maker. A route is proposed. The operator accepts or corrects it. The correction becomes a labelled example inside the same deployment.
Ticket counts do not show whether the refund, ERP update, or internal API call actually ran. Plugin health and recent execution context sit beside the queue so an operations lead can see when resolution is blocked after triage.
The plugin controls render inside the ticket page. That keeps eligibility, contextual inputs, approval, execution, and the returned result close to the work rather than behind a separate admin console.
The useful path starts with a queue signal and ends with a recorded outcome. Latch Workflow keeps the control points in one system.
A plugin can decide when an action is eligible, collect its inputs, route it for approval, execute it, and return the downstream outcome to the ticket.
Models classify, extract, and suggest inside the same workflow. Operators accept or correct the suggestion, and the correction stays useful to that deployment.
An MCP client sees bounded tools and tickets. Its calls pass through the same role, policy, approval, and audit checks as a human action.
Tickets, models, plugin credentials, and action execution can stay on your own infrastructure, including private-cloud and disconnected networks.
The ticket keeps the request, reviewer decision, denied attempt, execution timing, and external response instead of relying on a summary written afterwards.
Eligible actions and their inputs appear in the ticket itself, so contextual hooks can use the ticket state without sending the operator to another admin tool.
Status labels, SLA clocks, ticket classification, and reopen rules have to mean something before a chart built from them can be trusted.
Choose the sections operators need and keep the reporting range tied to the queue being reviewed.
Measure ageing, handoff delay, blocked work, rework, and outcome quality rather than one fast average.
Make status transitions consistent before using them to judge queue performance.
Keep closed hours out of response and resolution deadlines when the policy says they do not count.
Do not compare issue classes against one target when the commitments are different.
The dashboard is useful when its metrics stay tied to the ticket workflow, the plugin lifecycle, and the data boundary underneath them.
It shows ticket workload, active backlog, in-progress and resolved work, status and priority distribution, intake sources, issue-type volume, unclassified work, plugin health, and readiness for AI suggestions.
No. It is an operations dashboard for the ticket queue. It does not replace application monitoring, log search, infrastructure observability, a data warehouse, or a general business-intelligence platform.
Unclassified tickets weaken routing, reporting, and AI readiness. Keeping that count visible tells the operations lead where the data model needs attention before a percentage or model suggestion can be trusted.
The dashboard keeps plugin health and recent execution context beside queue metrics. The action controls themselves render inside the ticket page, where eligibility, inputs, approval, execution, and the returned outcome share the ticket context.
Yes. The dashboard runs with the rest of Latch, so ticket metrics, model-readiness signals, plugin health, and audit data can stay on infrastructure the organisation controls.
See the workload view, AI-assisted triage, in-page plugin action, approval, MCP authority, execution, and audit result in one product walkthrough.