Ticket totals tell you little when you cannot see where the work sits. Latch shows mapped sites and ticket demand by location in one view.
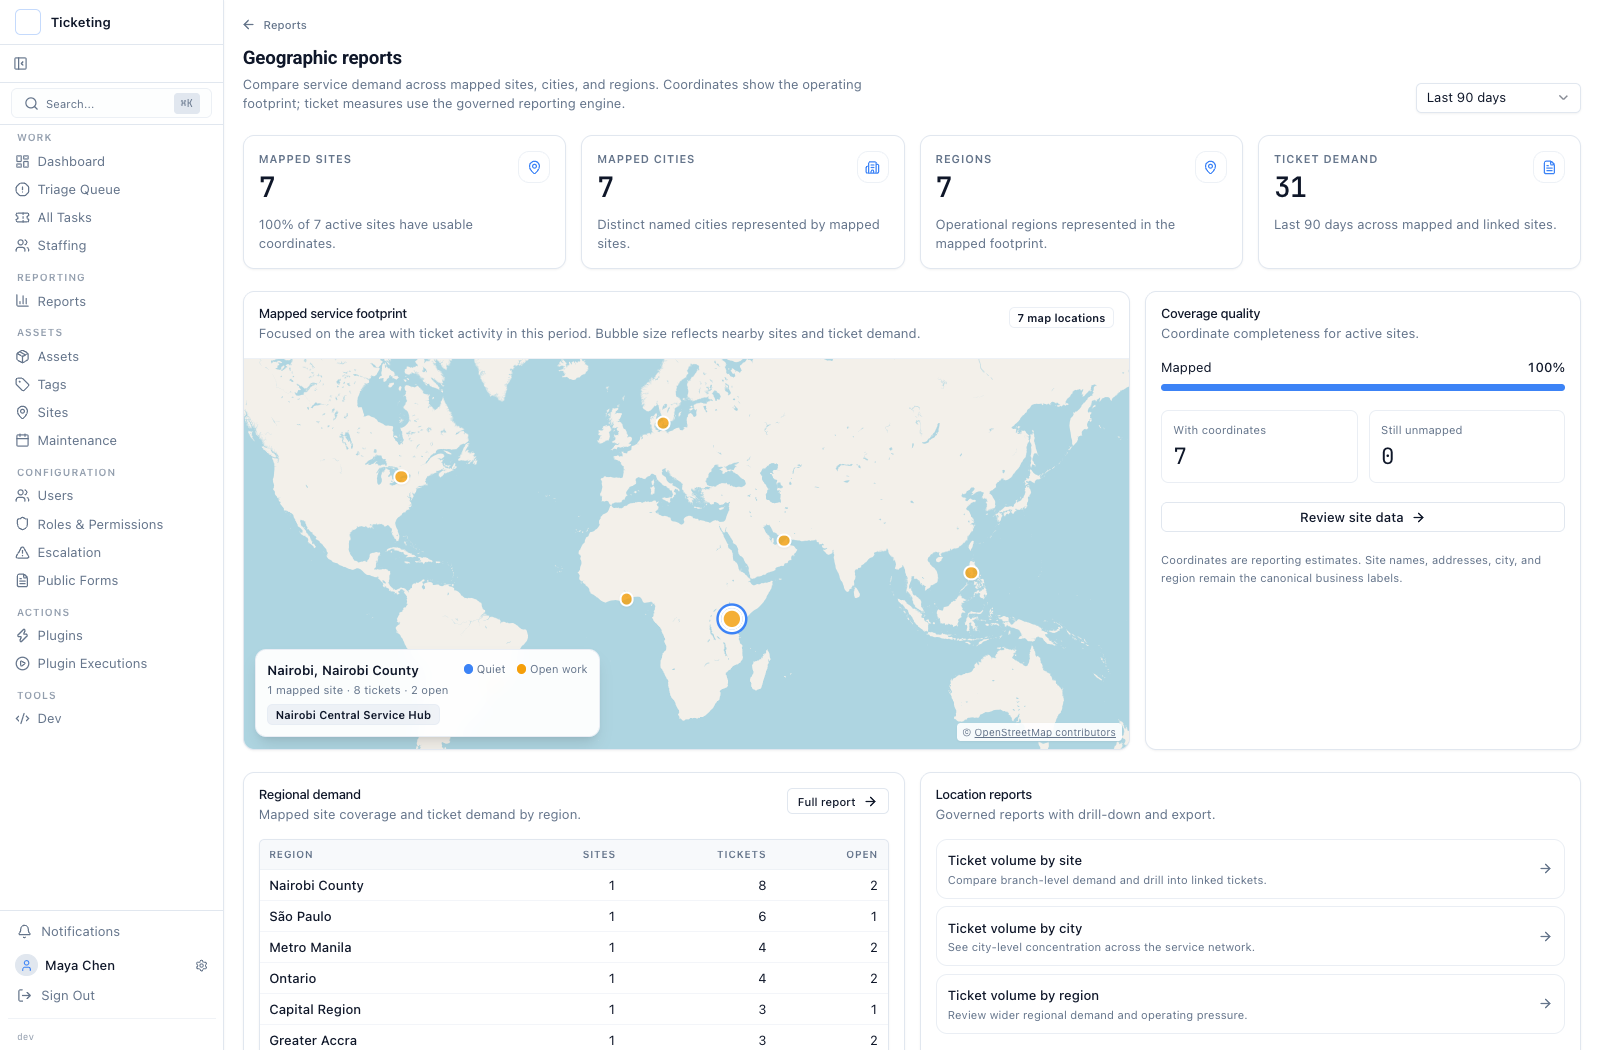
Fictional sample data: the report shows seven mapped sites, seven cities, seven regions, and 31 tickets in the selected 90-day window.
The map shows where sites are located. Follow the regional counts into a ticket-volume report by site, city or region to inspect the underlying queue.
The overview shows 31 tickets across mapped and linked sites. The detailed report counts 32 distinct tickets and keeps one with no site link in an explicit Unclassified row.
Coverage is part of the report
The coverage panel shows whether active sites have coordinates. In this sample, all seven are mapped. Coordinates describe where sites are, not where staff are or who is on shift. Read coordinate coverage beside ticket counts to see which locations are represented.
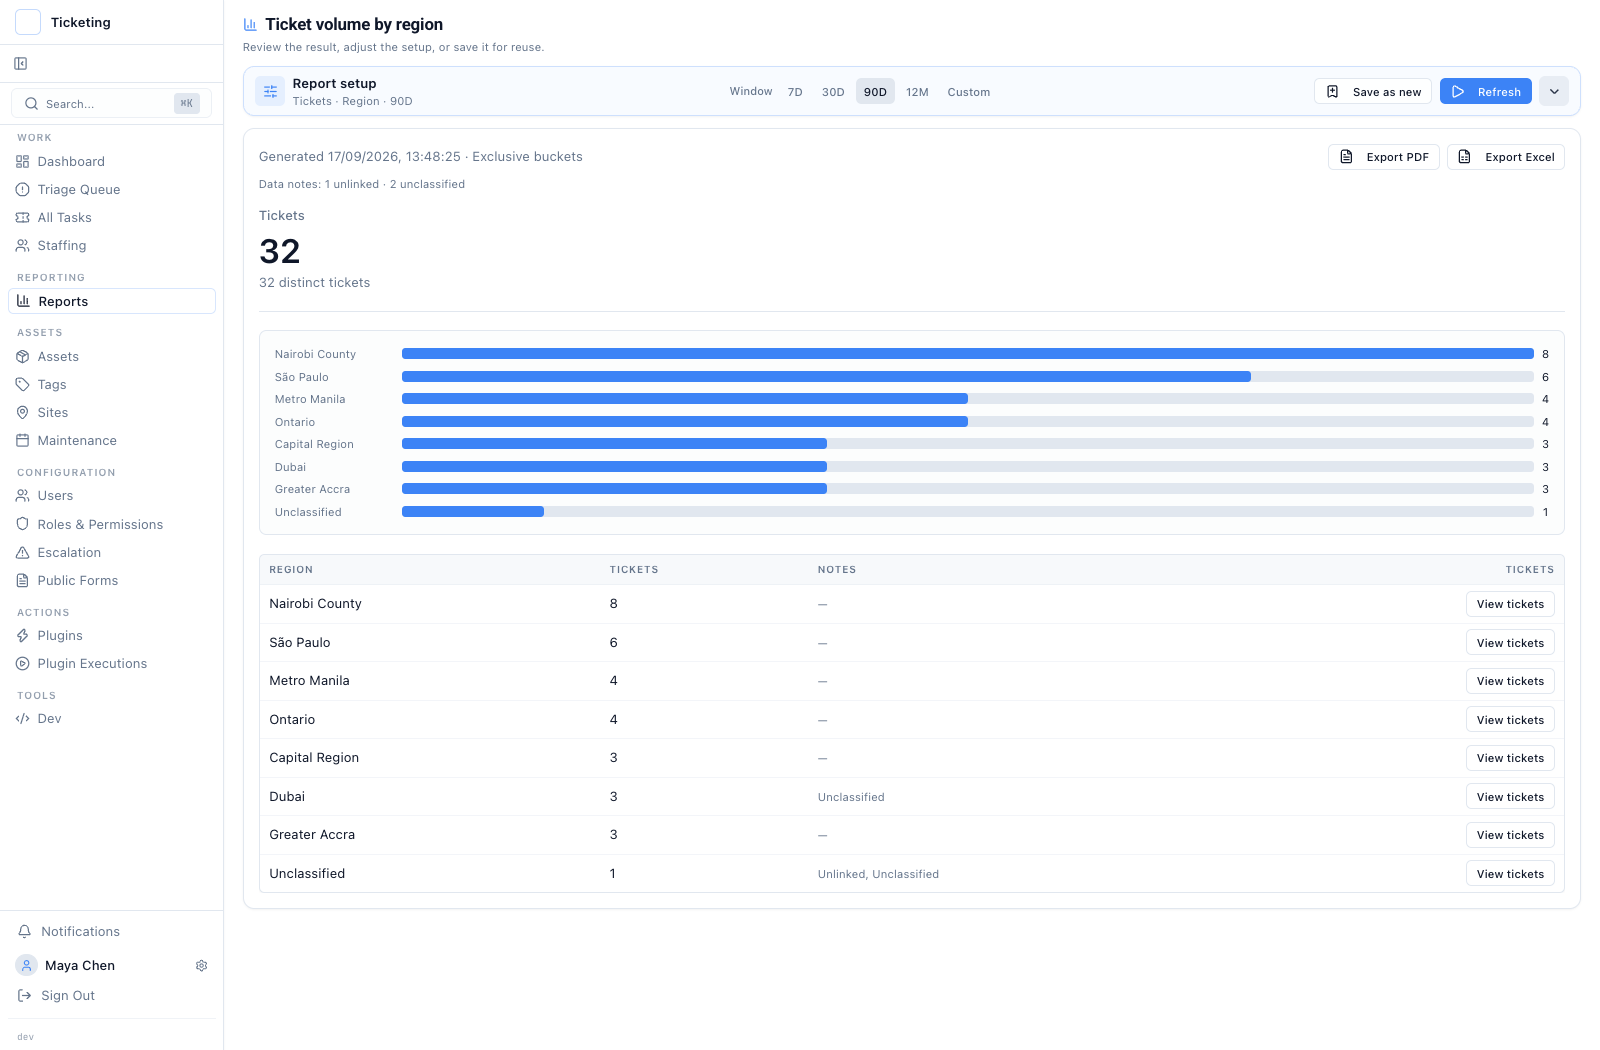
Fictional sample data: the detailed 90-day report retains one unlinked ticket in Unclassified, alongside regional counts for Nairobi County, São Paulo, Metro Manila, Ontario, Capital Region, Dubai, and Greater Accra.
Review the Latch reporting release for the wider reporting context.