An SLA breach report misleads when every ticket counts as eligible. Resolution Analytics begins with closed tickets that carry SLA deadlines, then tracks that cohort over time.
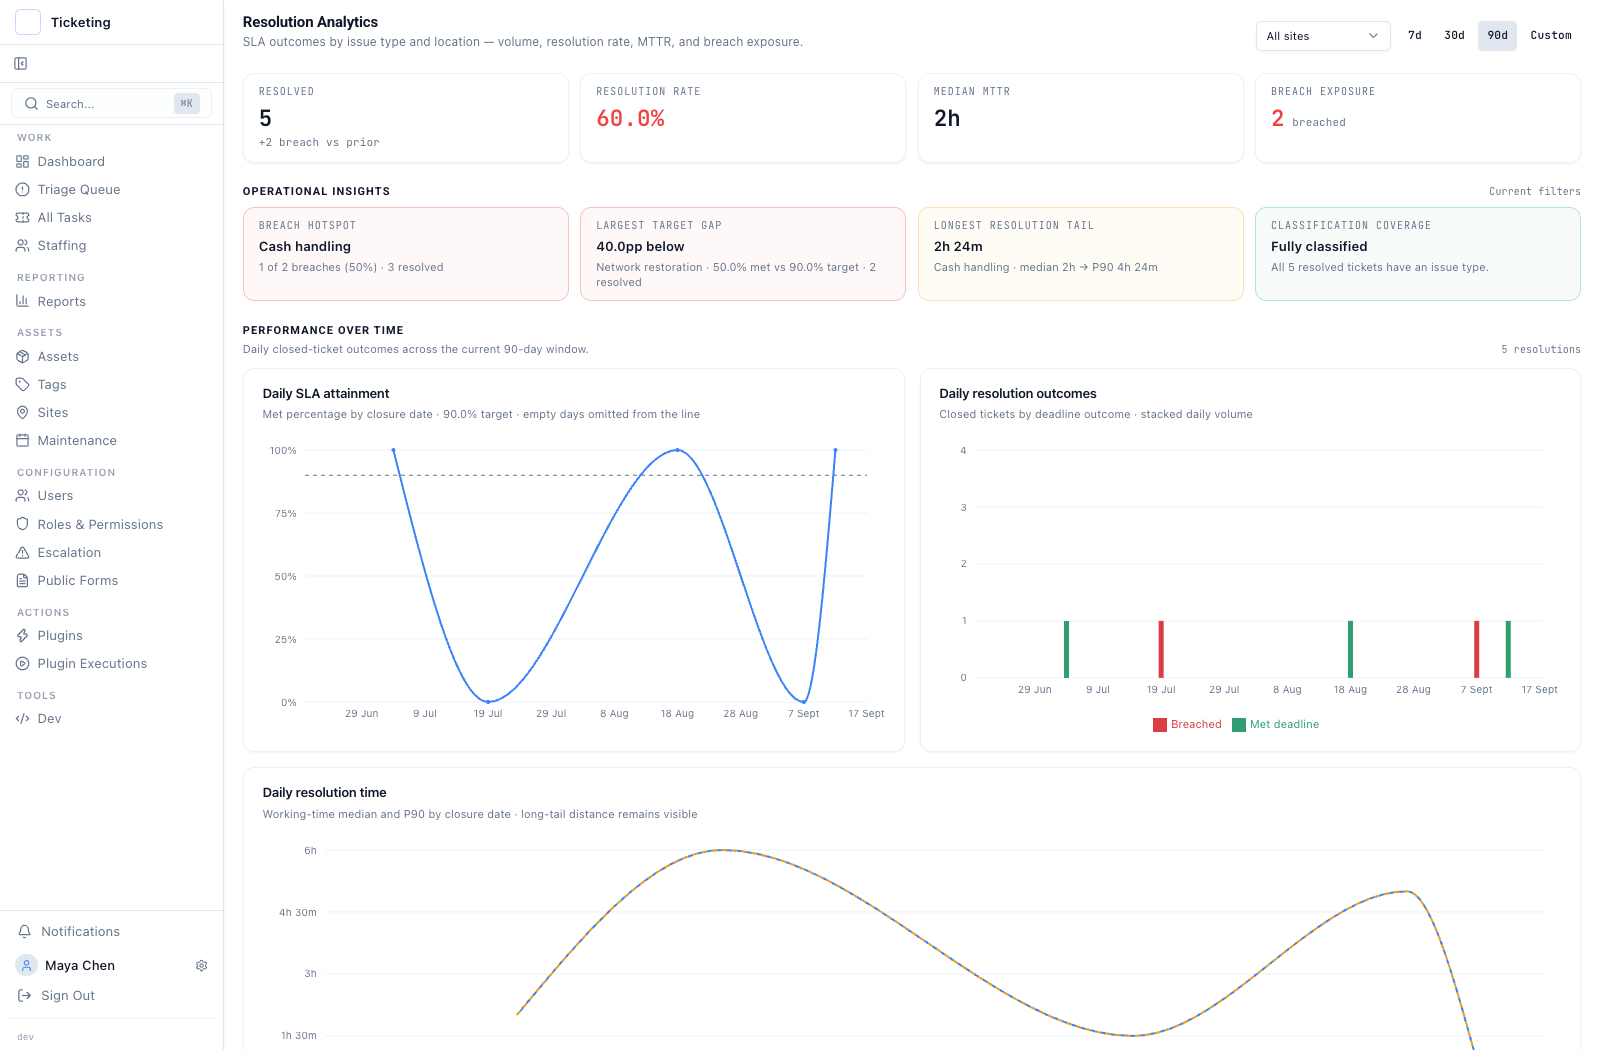
Fictional sample data: the Resolution Rate card shows 60.0% SLA met, or three of five resolved tickets, alongside two breaches and a 2h median MTTR.
The daily views keep three questions apart: how many tickets closed, what share met the deadline, and how working time varied. Median and P90 show typical and slower resolution times. Dates without observations remain blank.
Locate the breach pattern
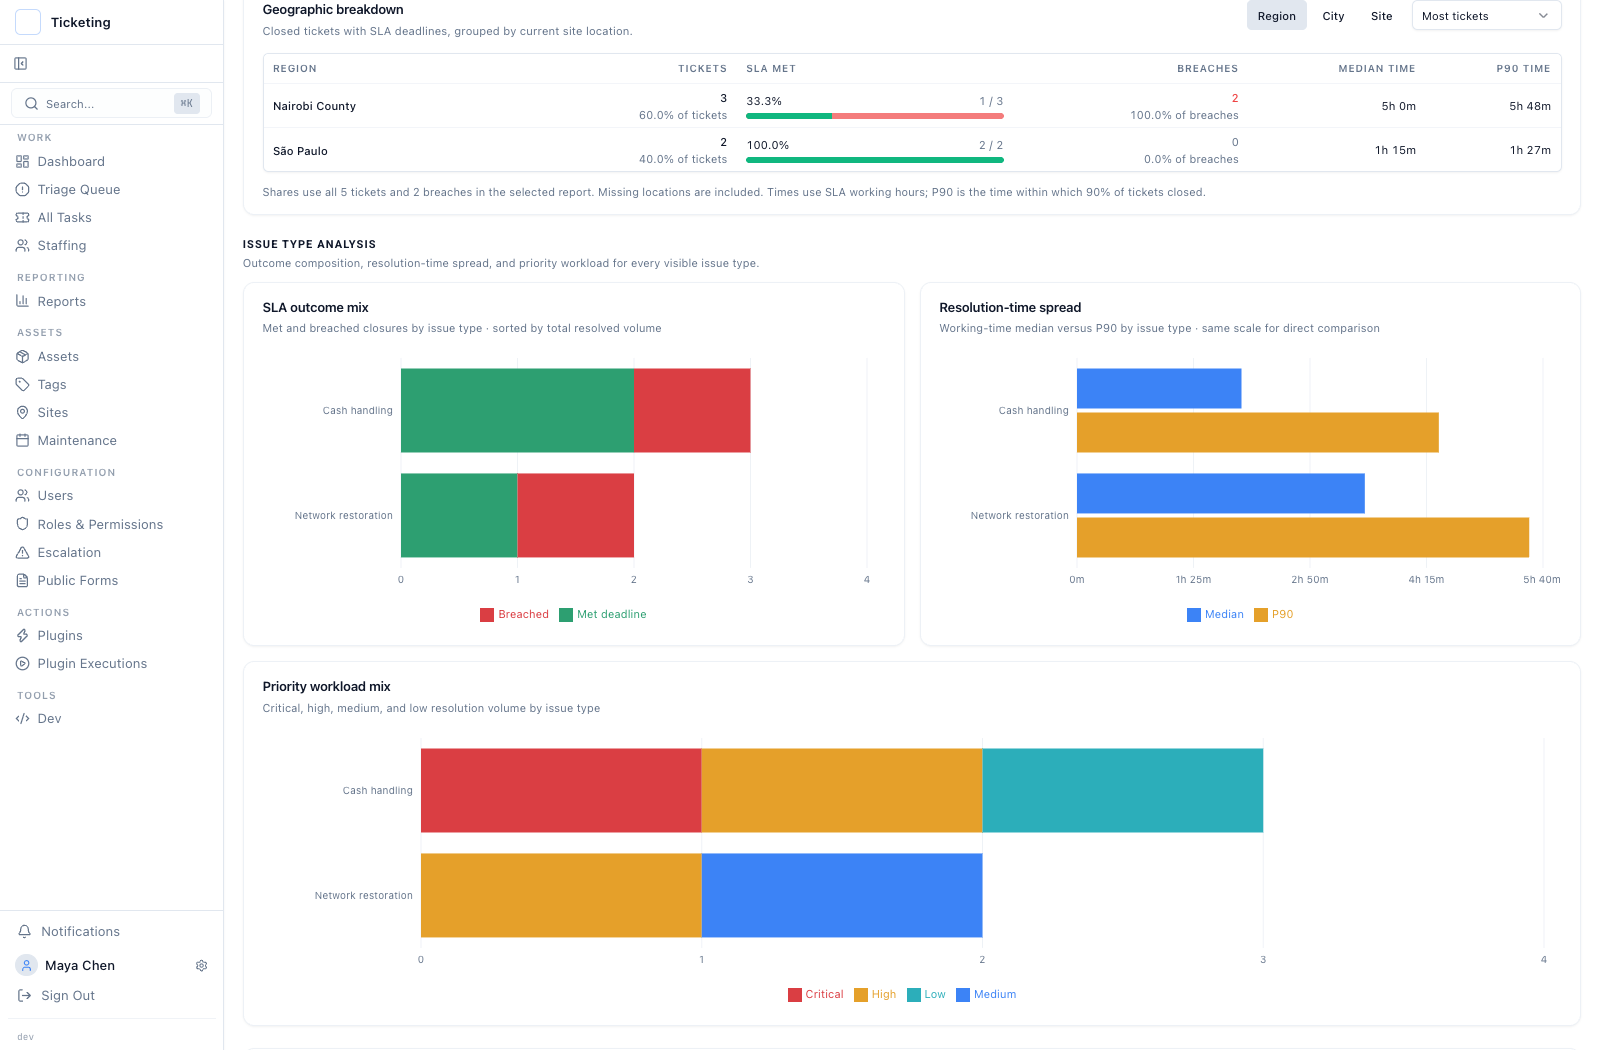
Fictional sample data: Nairobi County has three eligible tickets, one meeting SLA and two breaches; São Paulo has two eligible tickets, both meeting SLA.
The geographic breakdown shows regions, cities, and sites. It uses each ticket's current site location, and the denominators stay visible. Ticket shares use all five tickets in the report. Breach shares use the two breaches. SLA-met rates use each location's eligible ticket count. Working-time median and P90 sit alongside those counts.
A small site can post a high rate on little volume, or one region can carry most of the breaches. Either way, the report points to the next queue to inspect. It does not establish a cause.
Read the Latch reporting release for the broader reporting context.