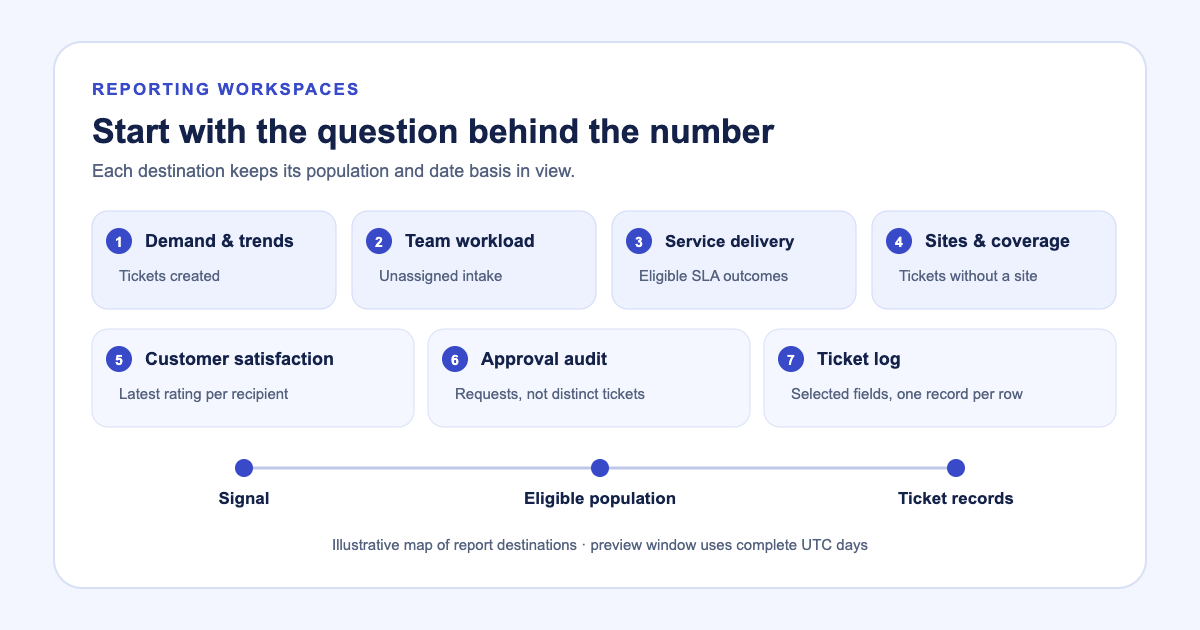
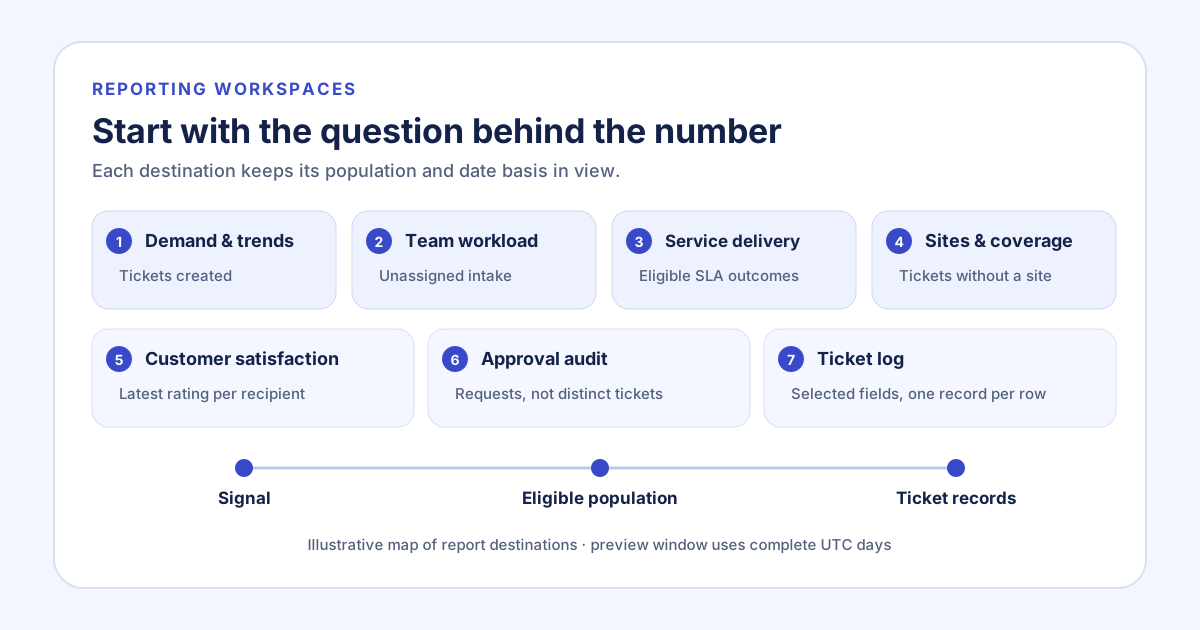
A report total is easy to quote and hard to trust when it hides which event put a ticket in the sample. Tickets created this month, tickets closed this month, and approvals requested this month answer different questions. Latch’s reporting workspace now groups seven report destinations by those operational questions, and the Service delivery destination adds a working view of completed outcomes and the queue that needs attention now.
Each destination row pairs a headline with a daily trend and a comparison of the latest seven complete days against the preceding seven. The preview covers the last 28 complete days in UTC. It shows aggregate measures without ticket, user, or recipient details; open a destination to inspect the report itself.
Start with the question, then choose a destination
Demand & trends follows ticket creation. Team workload highlights unassigned intake among tickets created in the window, using current ownership; it is not the age of the whole unassigned backlog. Sites & coverage flags created tickets with no effective site. Customer satisfaction follows feedback requests and latest recipient ratings. Approval audit counts requests rather than distinct tickets, while Ticket log opens individual records for inspection and export. Service delivery focuses on service tickets, deadlines, and the delays behind completed work.
This separation matters when someone sees a changing line. A rise in unassigned intake means more of the creation cohort is unowned now; it does not show every old ticket waiting for assignment. A higher SLA breach count belongs to the closed-ticket cohort with recorded deadlines. The staff workload view and geographic SLA breakdown let a lead investigate related questions by person or site. The customer feedback history follows a response back to the contact and request date.
Use Service delivery to move from trend to intervention
For a concrete example, imagine a five-person service team whose lead sees more breaches in the report preview. The lead opens Admin → Reporting → Service delivery, sets the 30-day or 90-day window, and narrows the view to a site if the question is local. The page states its date range, comparison range, timezone, and snapshot time so the lead can orient the comparison before acting.
The headline breach rate shows breached versus eligible deadline-bearing closures beside the prior period. Median resolution time is elapsed time, not SLA working time. A rolling weekly chart provides context for breach rate and P90 elapsed resolution time; a flow chart compares accepted arrivals with closures over complete days. The “Attention now” section is a live snapshot of accepted open work: overdue, due within 48 hours, unassigned, or without a deadline. An oldest-overdue list links into the tickets so the lead and technicians can review status, site, owner, and deadline.
Suppose that list surfaces an overdue ticket on the selected site. The lead can open its record and ask whether it is on hold, unassigned, or waiting on information, then check the owner’s update with the team. The dashboard also summarizes whether breached closures were open at least seven days, began before the selected period, or closed at least a day after deadline. Those describe the cases; they do not assign a cause to a person, priority, or location. The team uses them to choose what to inspect, then confirms the reason in the ticket history.
Historical counts use current ticket disposition and exclude Duplicate, Rejected, and Cancelled. SLA measures use deadline-bearing tickets closed in the selected local-date window, with the current day partial. Resolution time is elapsed, not SLA working time; the open queue is a live snapshot. The five-person team should not compare that queue total with a completed-ticket outcome as if they were the same measure.
Match the date basis before comparing totals
In the detailed report builder, choose whether the window applies to tickets created, closed, or either. “Created or closed” can include a ticket opened earlier when it closes during the selected period. Grouped reports can split counts by up to two dimensions; the ticket log carries the window and filters into one row per ticket, where selected fields can be inspected or exported.
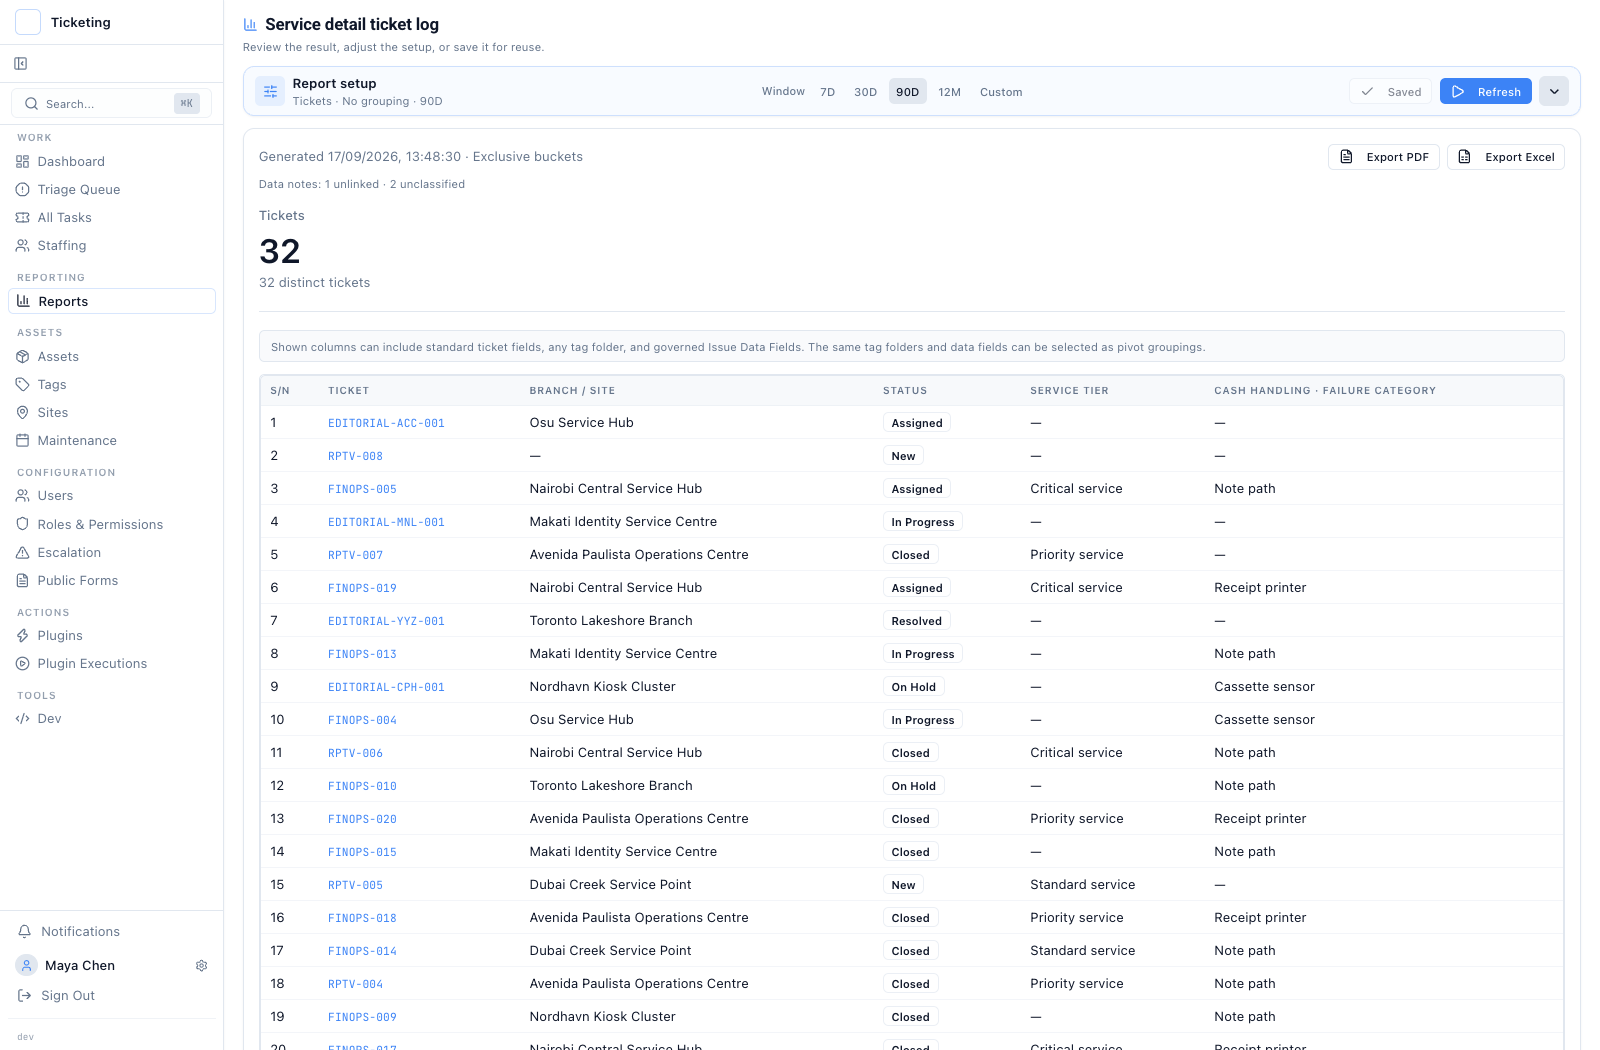
Ticket log after opening a detailed report, not the reporting-workspace catalogue. Captured 17 September 2026 with fictional sample records.
The practical path is short: open Admin → Reporting, choose the destination whose event and population match your question, read its date caption and denominator, then follow a chart or row into the records. The staffing view covers recurring schedules and modeled demand; it keeps those planning inputs distinct from recorded service outcomes. For a wider view of ownership and escalation, see field-service operations.