A queue can show that incident volume changed while hiding the equipment or work area behind it. Start with a grouped result, then open the ticket log when that result needs checking.
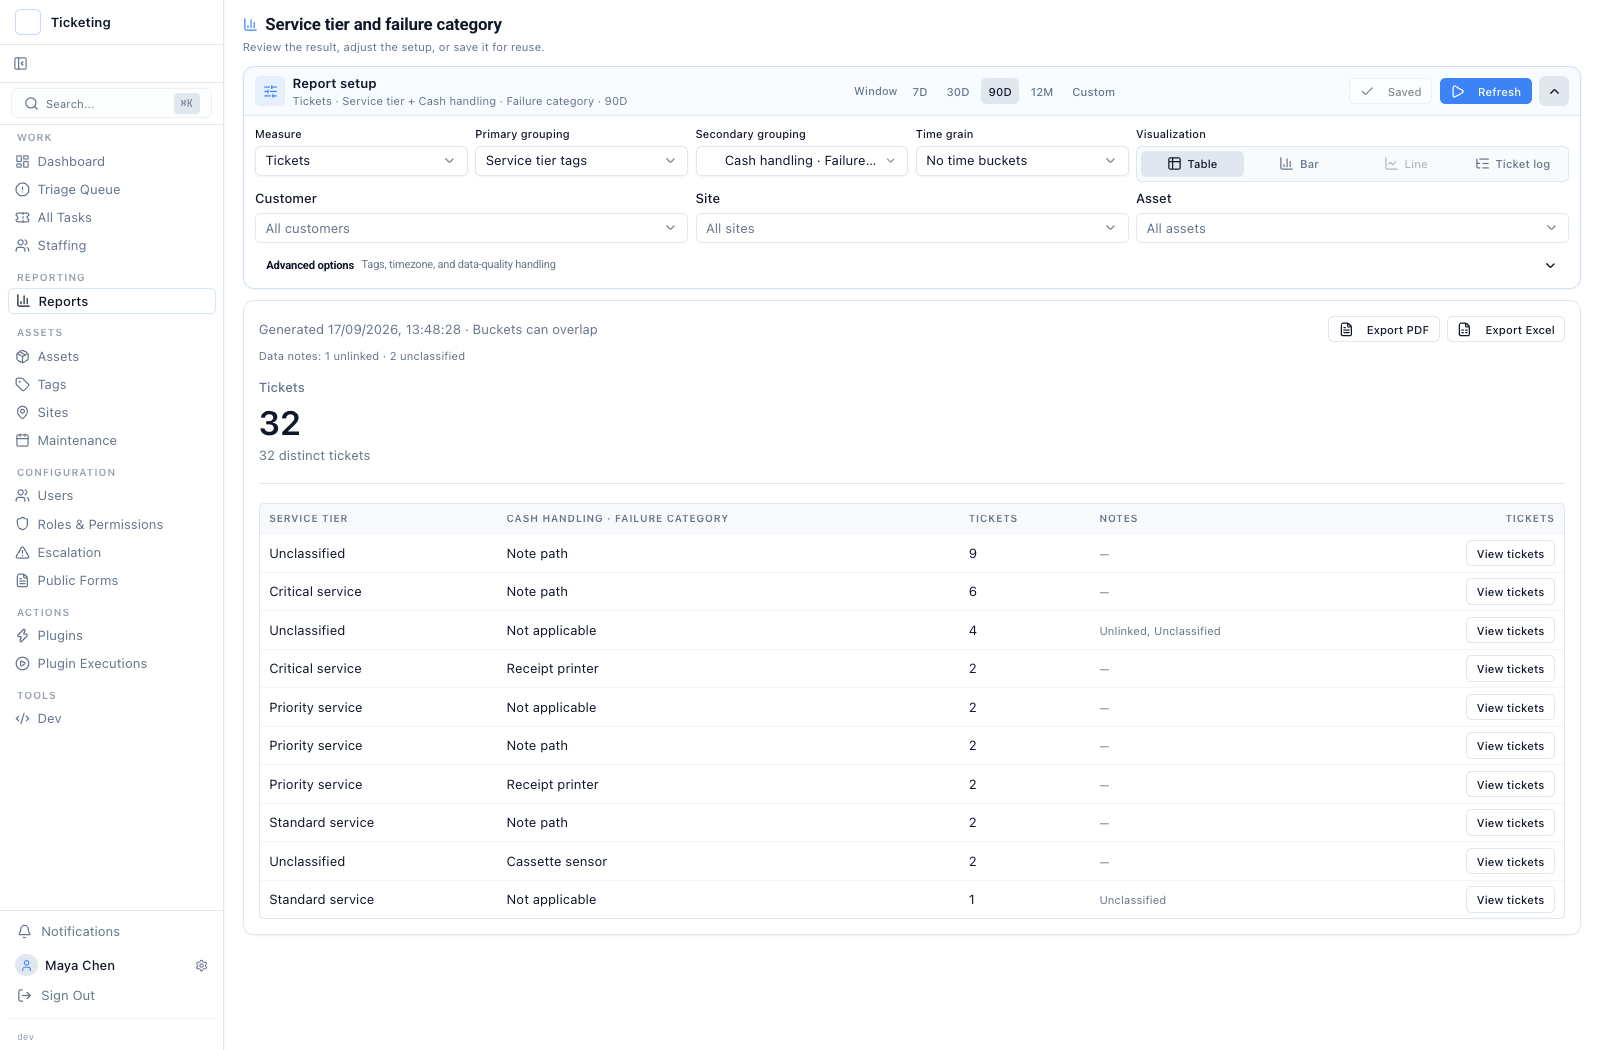 This grouped table counts tickets by Service tier tags first, then by the Cash handling Failure category Issue Data Field.
Group by the operational detail
Choose a measure, then add up to two groupings. The example groups by Service tier tags, then by Cash handling Failure category. Tag-folder buckets can overlap, because a ticket may carry more than one tag. Read each count against its own bucket definition rather than adding rows together.
The screenshots use fictional operational records.
Switch to the ticket log
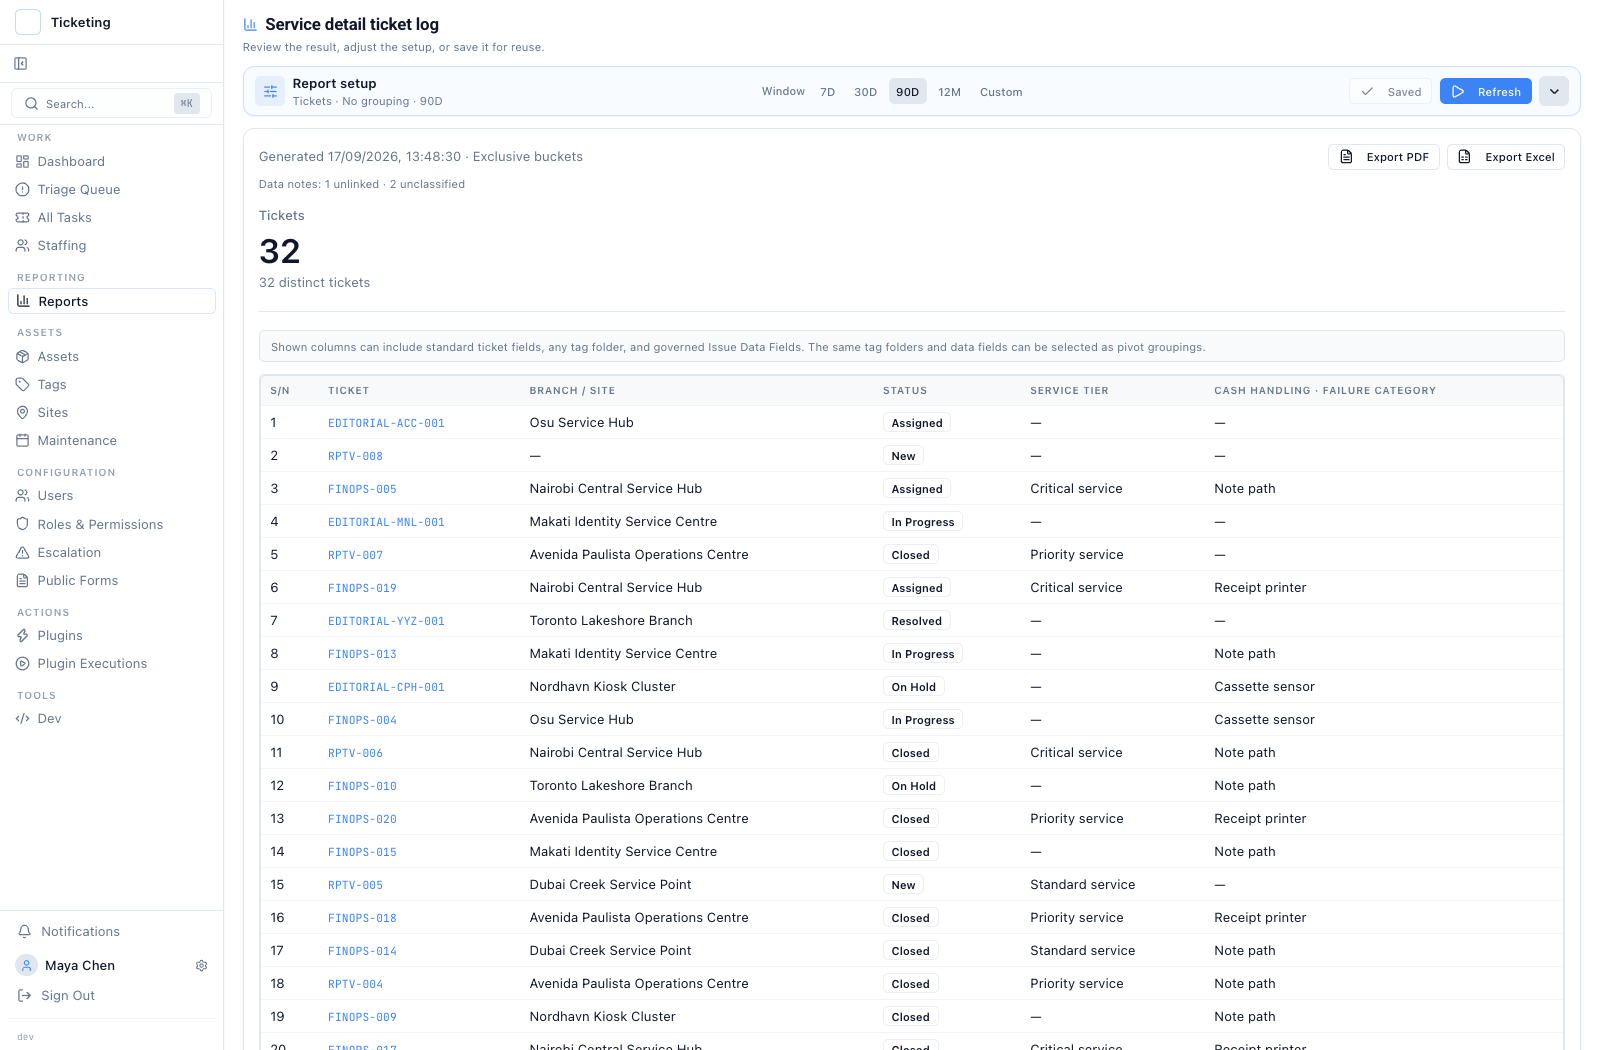 The ticket-log view has no groupings and shows the same reporting window and filters as individual ticket records.
Switch to Ticket log and the reporting window and filters stay, while the groupings are removed. Each row shows the selected fields for one ticket, and the ticket number links back to the individual record.
Choose the columns that matter
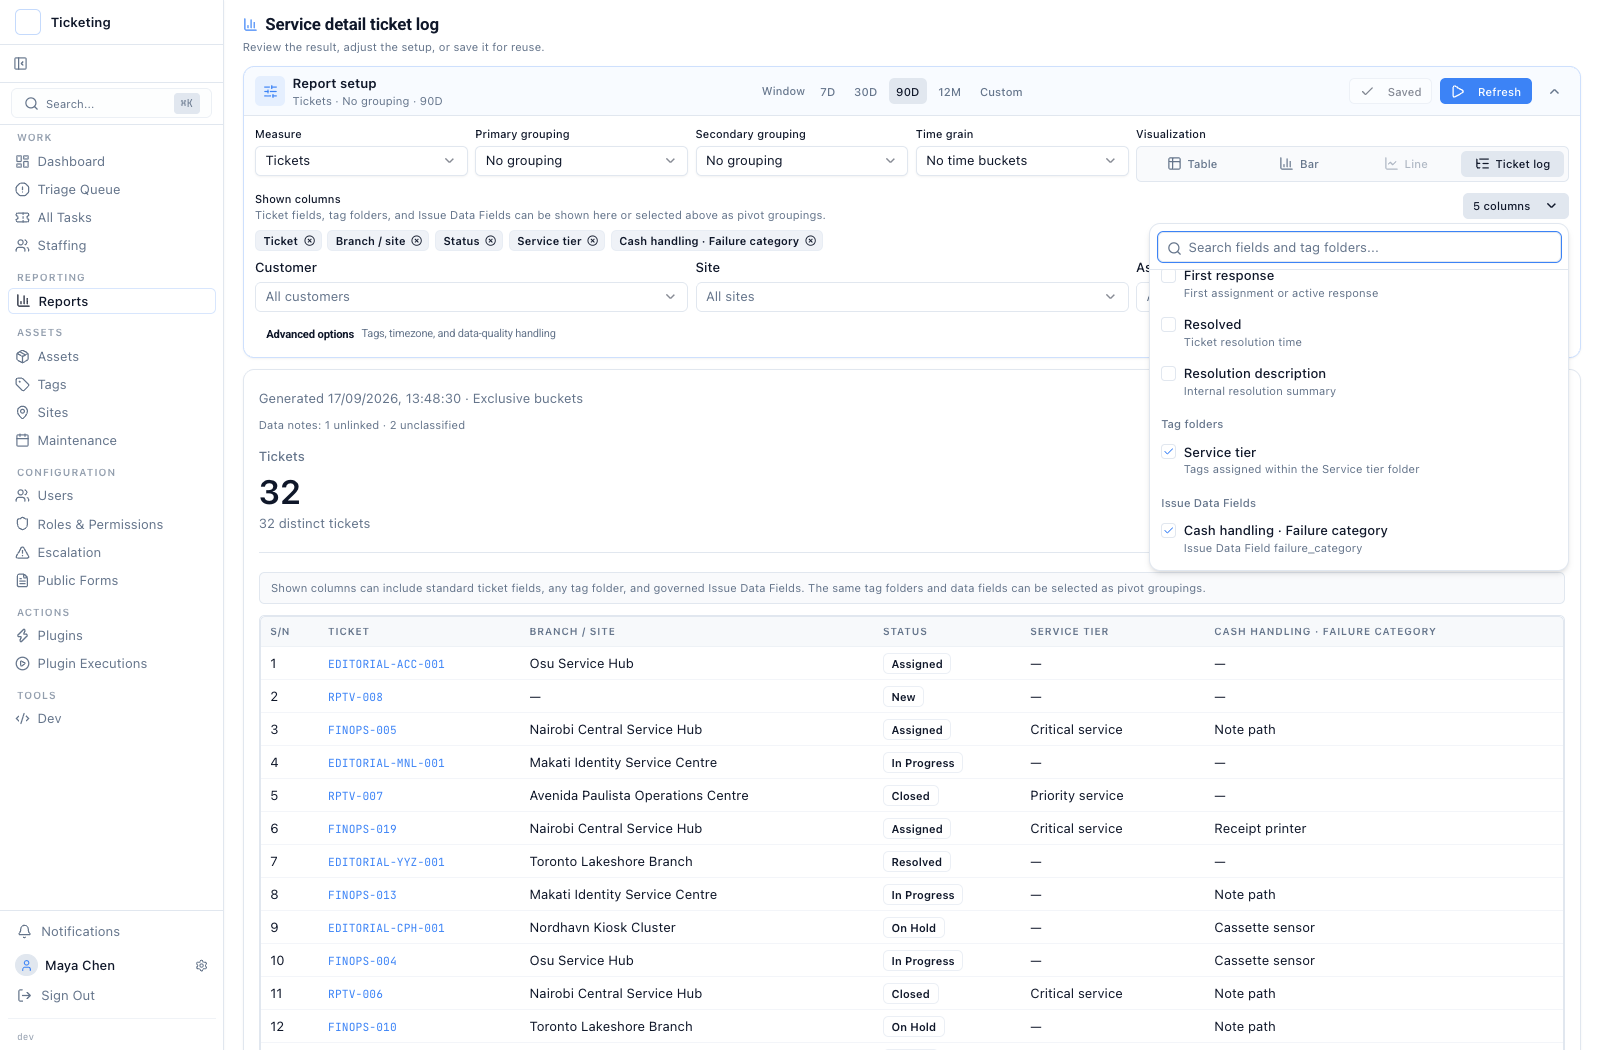 The picker is scrolled to Tag folders and Issue Data Fields, showing Service tier and Cash handling Failure category among the selected columns.
Select the columns that explain the work, then follow the ticket links to open a record. Read the Latch reporting release for a broader look at the reporting workspace.